Project Summary
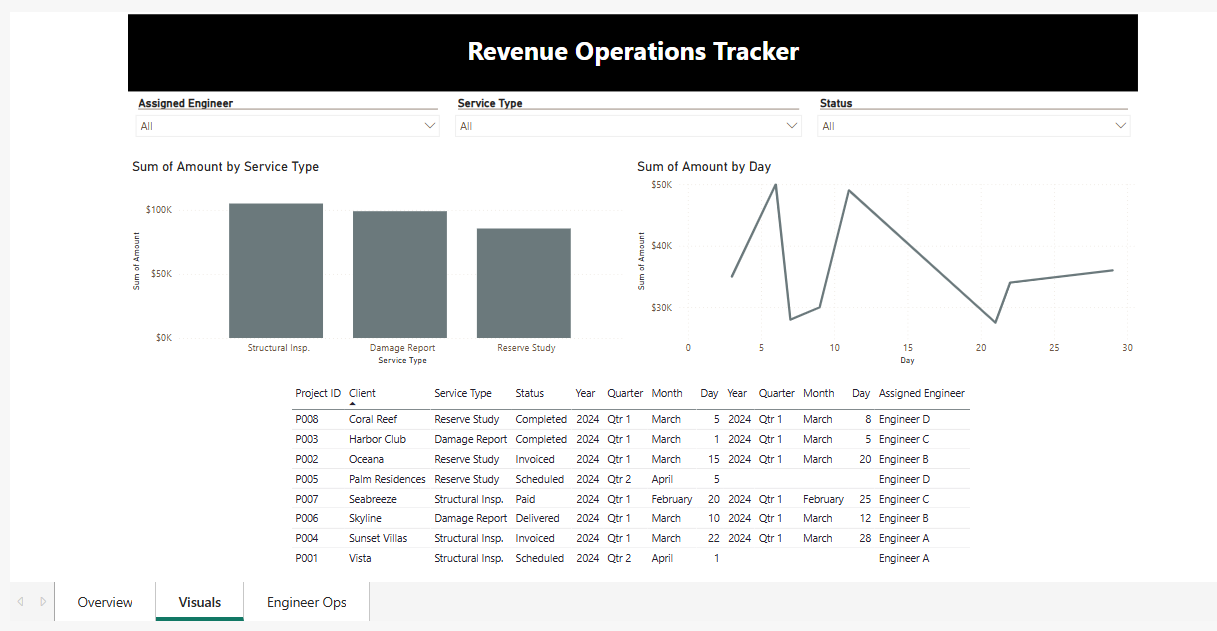
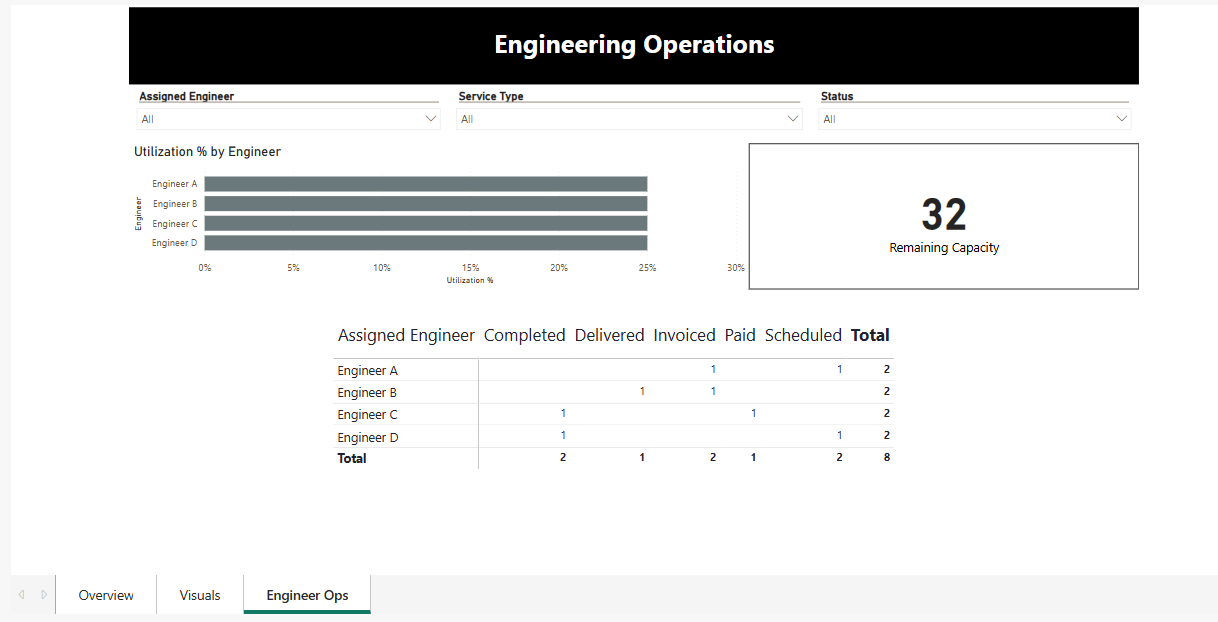
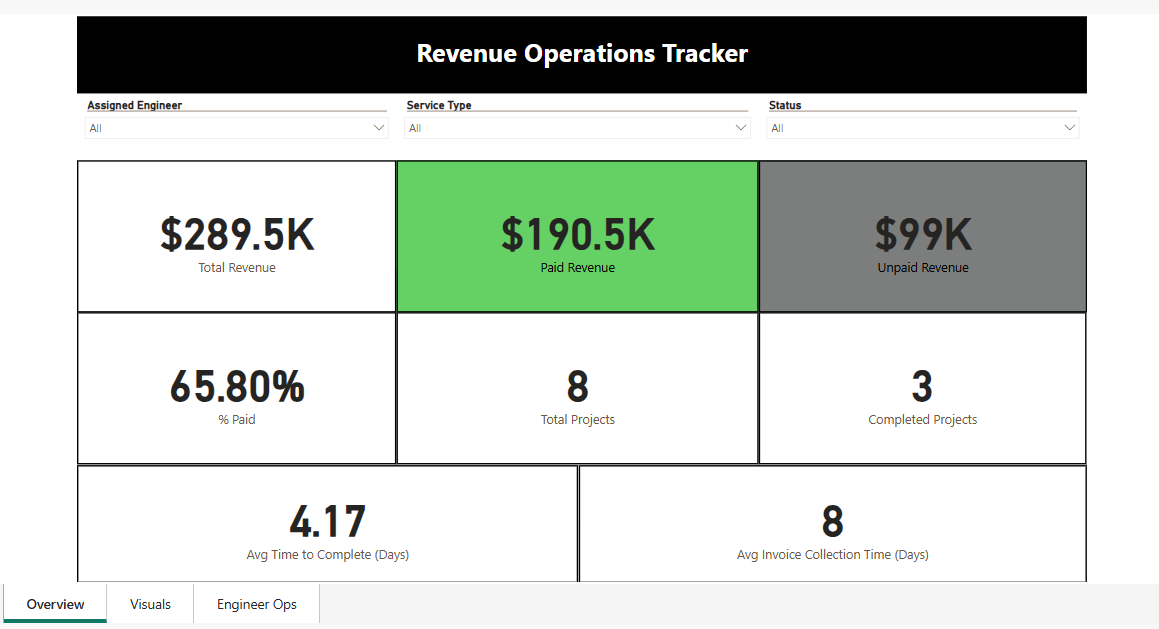
This dashboard provides a real-time simulation of project flow, engineer utilization, and revenue health across the operations pipeline. It highlights where jobs are slowing down, how quickly invoices are being collected, and how efficiently field resources are being used. Designed to support operational visibility, it enables better forecasting, faster decision-making, and smarter scaling.
Please note: this dashboard uses fictional data and is not currently in use by any company. It is intended solely to showcase analytical capabilities and the potential for performance-driven reporting.